|

|
Conference with François Gervais: The ’greenhouse effect’ under scrutiny

7 May 2015
Professor François Gervais of the François Rabelais University, Tours; and a Critical Rapporteur to the IPCC (International Panel on Climate Change) 5th Assessment Report, AR5, gave a presentation at a Solidarité et Progrès conference on 6 May, 2015, which was featured in the May 22, 2015 issue of Nouvelle Solidarité and translated here by Robert Hux.
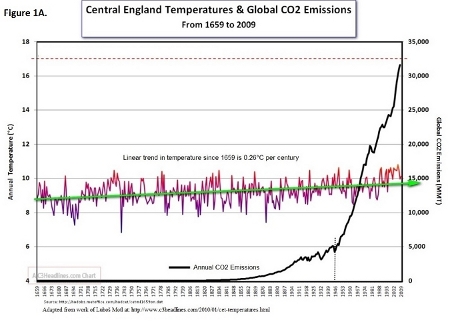
All of our institutions have embarked upon a crusade against emissions of carbon dioxide (CO2): the French government is organizing the next international conference on Climate (COP21, the 21st Session of the Conference of the Parties to the United Nations Framework Convention on Climate Change) at the end of the year and raising this fight to a “grand national mission”, the World Bank has just published a report on an economy without CO2, and the European Union has already spent 20 % of its budget for its climate policy, etc. It is well past time to ask: what is the scientific basis for the campaign to ban this molecule? It was to respond to this question that last May 6 Solidarité et Progrès (S&P) invited François Gervais, Professor Emeritus at the François Rabelais University in Tours, author of the book, L’innocence du carbone, published in 2013 by Albin Michel, but also an accredited critical reviewer for the Intergovernmental Panel on Climate Change (IPCC) of its Fifth Assessment Report, AR5, published in 2013. It is those reports of the IPCC which are used as a “scientific justification” for the anti-CO2 crusades led by the political institutions. During the conference-debate organized in Clichy by S&P (video available in French on our site), François Gervais presented the criticisms which he had made of the different parts of the IPCC report and exposed the deafness of the “scientific modellers” when faced with multiple inconsistencies. Here are his principal conclusions, based on the data collected and published in the 2000 page final report of the IPCC. You will see that they are much different than the media hype and alarmist political speech. Paradoxes as Big as Icebergs Mr. Gervais reminded the audience that the Earth’s climate has always changed. Thus, global warming began well before the beginning of the industrial era, under the reign of France’s Louis XIV, in 1695, which contradicts the hypothesis of an anthropogenic warming. This change in temperature, as shown in the “Central England temperature record” which includes measurements from one of the oldest thermometers (Figure 1A), followed a very cold period, where the horses were able to cross the frozen River Seine.
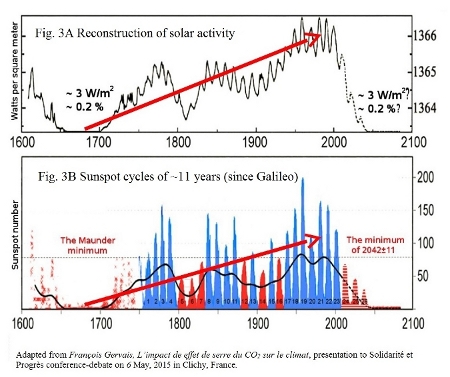
(Figure 2) Scientists attribute this to an awakening of the Sun, whose activity can be reconstructed thanks to the observations of sun spots made since Galileo.
(Figure 3)
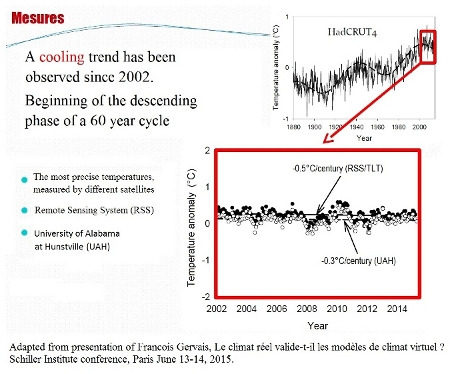
Are we living through a new period in which the Sun is falling asleep? Although the press remains silent on this subject, satellites which have been recording temperature since 1979 have registered a cooling since the beginning of the 2000s. (Figure 4)
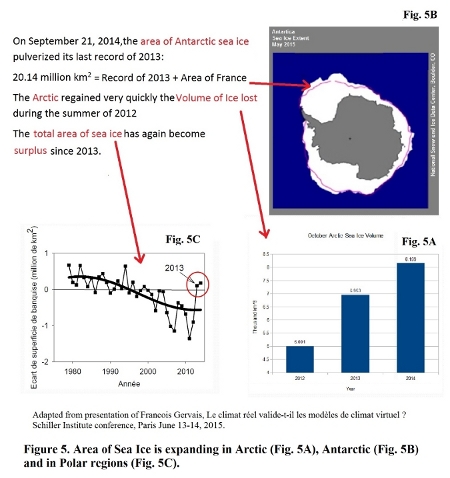
The cooling trend began to make itself felt as well at the poles. Do you remember the film of Al Gore, “An Inconvenient Truth”, released in 2007? On receiving the Nobel Peace Prize with the IPCC, he declared that there would be no more sea ice at the North Pole by the Summer of 2013! But the Arctic sea ice practically doubled in volume between its lowest level at the end of the Summer of 2012 and that of 2014. (Figure 5A) At the South Pole, the area of sea ice has broken its previous record of 21 September 2014. (Figure 5B) Silence in the Media.
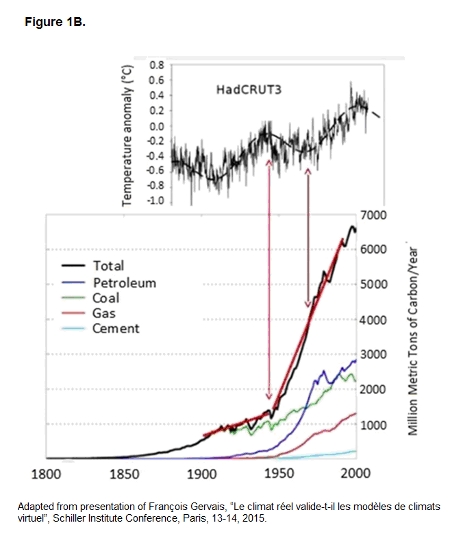
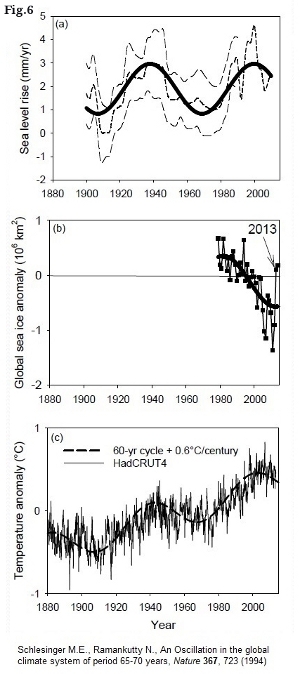
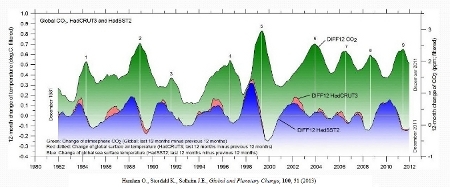
As for the oceans, if there is cooling, the ocean levels should also go down. This is confirmed by the most recent data, despite all the projections of the IPCC models. (Figure 6)
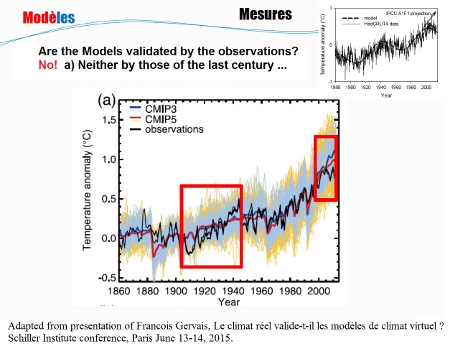
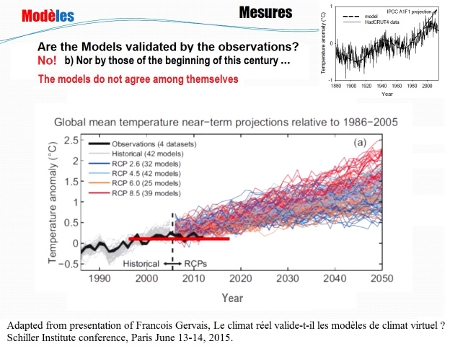
In reality, such a cooling is not new. Between 1940 and 1970, the temperatures fell as well, (Figure 6) only to rise again later. What were the newspaper headlines then? “We are entering a new ice age!” Yet, there was an acceleration of CO2 emissions starting in the 1940s. According to the theory which asserts that CO2 is the factor which determines the climate, the temperatures should have gone up accordingly. What Mr. Gervais observed, in return, is that these climate variations – the rise in ocean levels and temperatures, the extension of the area of sea ice (Figure 6) – indicate a cycle of about 60 years, a phenomenon already displayed in 1994 in an article published in the prestigious scientific journal Nature. [1] Nicola Scafetta, an American scientist, showed that this climatic cycle of 60 years was correlated with the speed of the Sun in relation to the center of gravity of the Solar System, but the causal connection remains to be proven. [2] Meanwhile, the IPCC editors do not wish to hear about these cycles totally uncorrelated to CO2, although they appear in their own graphics. A Politicized Report? The conclusions of the IPCC reports (2000 pages) are synthesized into a much shorter summary for the public at large and for policy makers. Among those who participated in the writing of these summary reports, there were not only scientists but also representatives of different governments (thus the “I” in IPCC, for “Intergovernmental”), and Mr. Gervais could therefore observe how certain elements present in the complete report had disappeared in the final summary report [published on 27 September, 2013]. In particular, the caution with which the modellers presented their projections. This caution was necessary, since their models based on the hypothesis that the greenhouse effect of CO2 is the principal factor determining the climate, failed absolutely to foresee the actual cooling, and are also not validated by the past, for they are also incapable of reproducing the climate variations of the last century. (Figure 7)
As Mr. Gervais noted in a subsequent presentation [3], “since the temperature did not rise since the end of the last century, the models give temperature projections which are systematically above the measurements.” Moreover, “all these models disagree with themselves, including those adopting the same scenario of emissions.” (Figure 8) The range of “the most probable” temperature increases (high and low estimates) calculated by these models, has seen its upper limit getting lower and lower in successive versions of the report. But in the final summary of 26 pages, this mention of “the most probable” had simply disappeared! Mr. Gervais calculated the uncertainty in the estimates of the temperature increase expected by 2100, the ratio of the high and low estimates: 4.8°C/0.3°C = 1600%! Which would make any serious scientist laugh! But that didn’t stop them.
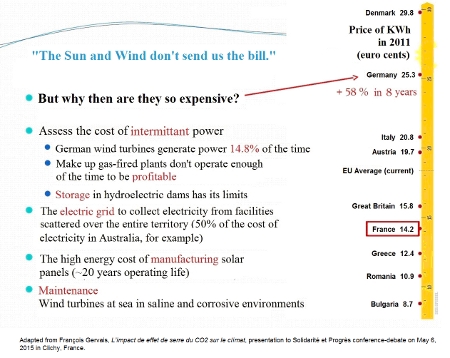
A minimum impact for a maximum cost Encouraged by these ridiculously imprecise estimates, the European countries have established goals for reduction of their CO2 emissions. According to the calculations of François Gervais from IPCC data, in applying its policy of a 20% reduction, Europe will avoid, at maximum, a warming of 0.014°C. Since France produces 1% of the global CO2 emissions, its share in this would be, at most, 0.0009°C. No thermometer is sensitive enough to measure an impact so small. In other words, it is impossible to measure the real impact of these policies on the climate. But it is not a laughing matter any more, when you look at the economic cost of this energy transition which is promoted under the guise of an emergency to “save the climate”. The climate policy represents 20% of the European budget. We turn towards the development of renewable energies, since “the sun and the wind don’t send us the bill.” (Figure 9) But why then are they so expensive?
To collect these energies less dense than petroleum or nuclear power, we have to deploy more physical and human effort in order to generate the same quantity of power. Add to this problem the extra costs of managing these so-called alternative energies. For these energy sources are intermittent and we can not store electricity. It is necessary to build a much more extensive network to collect them. But the electrical grid is the biggest part of your electricity bill.
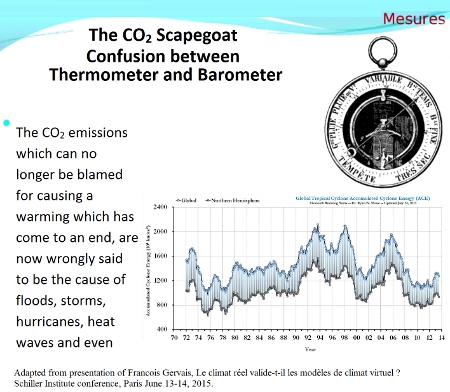
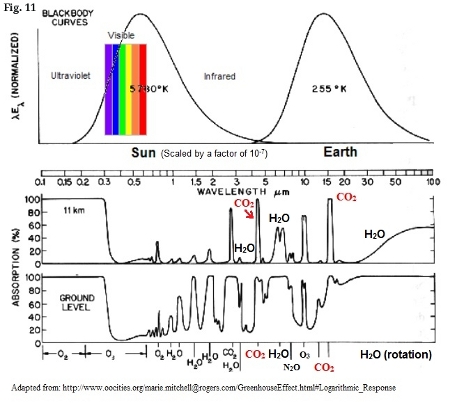
The intellectual impact is much more pernicious. Since the time the decrease in temperatures could no longer be ignored, nor the obvious conclusion that the theory that CO2 warms the climate is false, our poor CO2 molecule has been accused of causing all kinds of extreme phenomena! Typhoons, floods, cold spells… This hypothesis on which the media cheerfully surfs was not even proposed by the IPCC let alone scientifically proven in their reports. Which impelled François Gervais, during a debate with Pascal Canfin (former minister and European Member of Parliament, ecologist, today a principal advisor to the World Resources Institute), to remind him that it is on barometers that it is written “storm, good weather, etc.”, and not on thermometers! But it is not only our Ministers who ignore the basics. As a member of an examining board to confer student scholarships on students at the end of a Masters in Earth Sciences program, François Gervais had this troubling exchange with a student wanting to do a thesis to save the planet. FG: “What is the concentration of CO2 in the Earth’s atmosphere?” The student’s response: “70%” Faced with the astonishment of the examiners, the student then corrected himself: “5%.” Another student under examination later gave the same response. But even with 5%, it’s 100 times too big! This is from students at a Masters degree level! The proportion of CO2 in air is 0.04%, or 400 parts per million, much less than that of the other principal greenhouse gas, water vapour (1 to 5%). In Fact, What is CO2? As an expert in spectrometry, Mr. Gervais gave a physical explanation of why CO2 has so little effect on the climate. It is important to understand that the CO2 molecule only vibrates at two frequencies, 70 terahertz (THz = 1012 cycles per second) and 20 THz, corresponding to the wavelengths 4.3 and 15.0 microns (μm), and can only absorb heat at these unique frequencies. In other words, the infrared radiation (heat) emitted by the Earth will only be picked up by the CO2 at these two points. If we make a rough comparison between infrared radiation and visible radiation, a rainbow would lose two colours in passing through a layer of CO2. The CO2 molecule is therefore in reality a veritable sieve that allows a large part of the heat to pass through without the power to capture it. Moreover, different measures show that 95% of the radiation which is able to be picked up is already absorbed by the existing CO2 layer within 100 meters of the Earth’s surface: the greenhouse effect of atmospheric CO2 being already practically at its maximum, there is not much left for additional CO2 molecules to absorb. That means concretely that for 20 molecules of CO2 emitted into the atmosphere, only one will participate potentially in the greenhouse effect, and that the more the concentration of CO2 increases, the more this proportion decreases.
Furthermore, we could even doubt that the increase in the atmospheric CO2 concentration is principally due to human activity, even if that seems to make sense. Indeed, what happens when we superimpose the variations in CO2 concentration with the temperature variations? (Figure 12) It is the variations in CO2 concentration which follow the temperature, which could be explained by the fact that the CO2 dissolved in the oceans is released when the ocean warms, for example. This is the phenomenon of the bottle of champagne that we left in the sun!
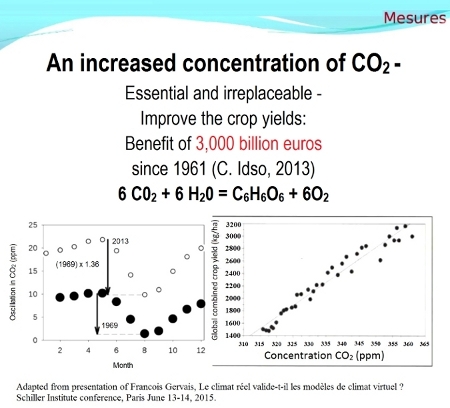
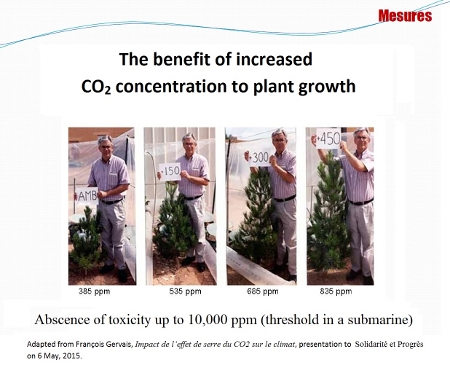
Mr. Gervais also recalled a truth often forgotten: CO2 is the food for plants! A detailed analysis of variations in atmospheric CO2 over the course of the year (its concentration decreases in Spring and Summer with the growth of vegetation, and increases in autumn and winter) shows that plants seem to voraciously seize upon any additional CO2, as if they were undernourished. The scientist C. Idso has even calculated a 3,000 billion euro benefit which has resulted from increased agricultural yields attributable to the higher CO2 levels since 1961. [4] Far from being a pollutant (like the soot and fumes of coal mines, which are responsible for thousands of deaths each year), CO2 even seems to promote the development of the biosphere!
In conclusion, Let us emphasize that the material presented at this conference is a synthesis of about 1,300 scientific publications. “We are many!,” he said. To speak of a scientific consensus on the human origin of global warming is a lie. On the other hand, to diagnose that the essential climate changes which we observe are linked to natural phenomena, does not mean encouraging people to burn all the petroleum they can!
Of course, fossil fuel resources are limited (even if no one can precisely estimate the actual global reserves of petroleum because the data is confidential), and we should leave some for our grandchildren, especially for making plastic. Of course, we really are going to need to go to alternative energy sources. But the message is clear: there is no urgency! Let us take the time to develop methods of production of really effective alternative energy sources and durable non-intermittent energy sources: solar, thorium-based fission, thermonuclear fusion. The $89 trillion which this futile effort against natural phenomena would cost on a global scale [5], because of its incompetence, let us rather invest them to permit every nation to develop. As S&P has documented since the 1990s, it is precisely because this scenario would be a nightmare for the international financial Malthusian oligarchy that they are the first to endorse, finance and promote pessimistic environmentalism, which, explicitly or implicitly, reduces human beings to the level of parasites on the Earth. [1] M.E. Schlesinger and N. Ramankutty, Nature, 367, 723 (1994) [2] N. Scafetta, J. Atmospheric and Solar-Terrestrial Physics (2009) [3] François Gervais, L’innocence du carbone, presentation at International Schiller Institute conference, Rebuilding the World in the BRICS Era, 13-14 June, 2015, Paris. [4] Craig D. Idso, Ph.D., The Positive Externalities of Carbon Dioxide; Estimating the Monetary Benefits of Rising CO2 Concentrations on Global Food Production, Center for the Study of Carbon Dioxide and Global Change, 21 October, 2013. [5] World Bank estimate cited by Mr. Gervais, Ibid. |